原因
主要是spring-boot版本和micrometer版本没有对应上,我用的spring-boot是2.6.0对应的micrometer就是1.8
需要修改两个地方
pom.xml
	<dependency>
		<groupId>org.springframework.boot</groupId>
		<artifactId>spring-boot-starter-web</artifactId>
	</dependency>
	<dependency>
		<groupId>org.springframework.boot</groupId>
		<artifactId>spring-boot-starter-actuator</artifactId>
	</dependency>
	<dependency>
		<groupId>io.micrometer</groupId>
		<artifactId>micrometer-registry-prometheus</artifactId>
		<version>1.8.2</version>
	</dependency>
application.yml
#Prometheus springboot监控配置
management:
  endpoints:
    web:
      exposure:
        include: '*'
  metrics:
    export:
      prometheus:
        enabled: true
    tags:
      application: ${spring.application.name} # 暴露的数据中添加application label
重新编译后访问http://localhost:8080/actuator/prometheus能正常获取到数据了
spring-boot 2.6对应micrometer 版本 可查看 https://github.com/spring-projects/spring-boot/wiki/Spring-Boot-2.6-Release-Notes 搜索Micrometer就能找到,如下图
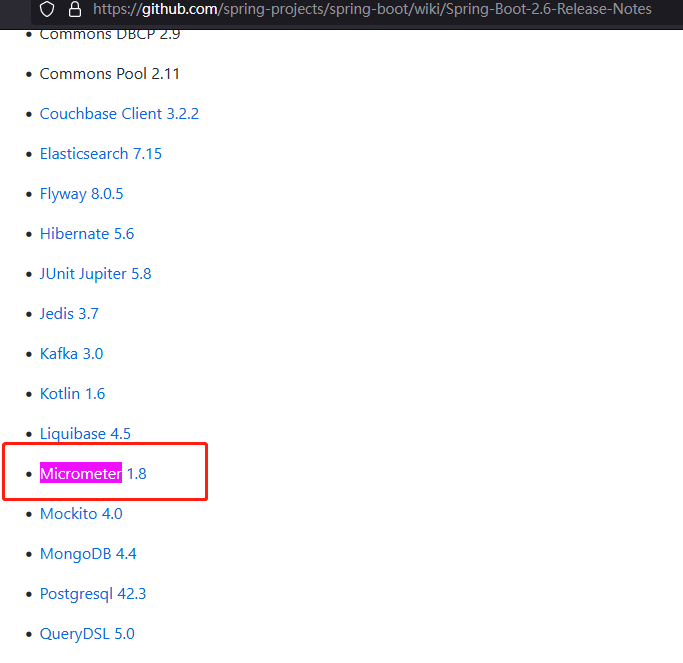
spring boot如果是2.4,对应micrometer版本是1.6, 其他版本的·spring-boot·可以先在https://github.com/spring-projects/spring-boot/wiki 找到对应的spring-boot版本然后再在wiki下找到依赖的micrometer版本
原文参考: https://blog.csdn.net/linzhiji/article/details/112425193