资源相关
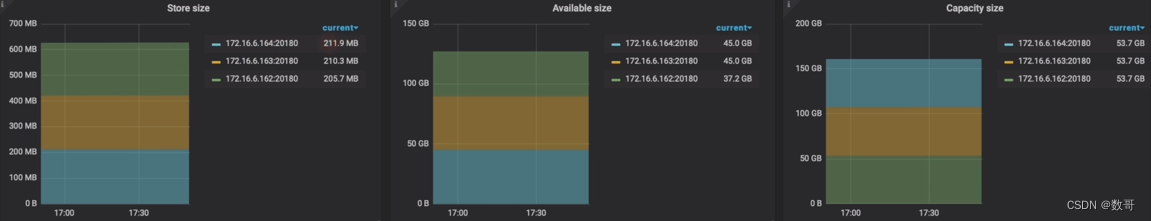
Grafana监控 TiKV-Details —> Cluster - Store Size / Available Size
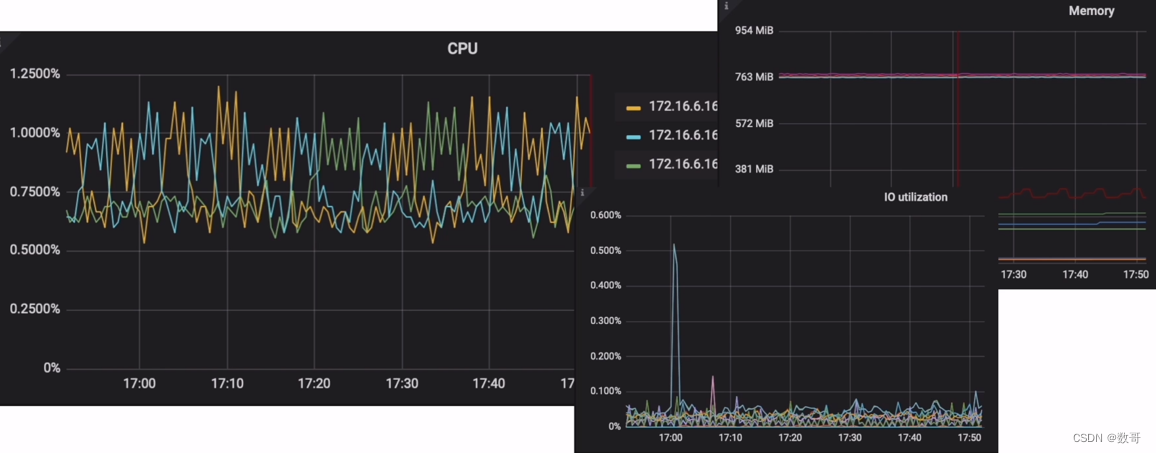
Grafana监控 TiKV-Details —> Cluster - Cluster - CPU/Memory/IO Util
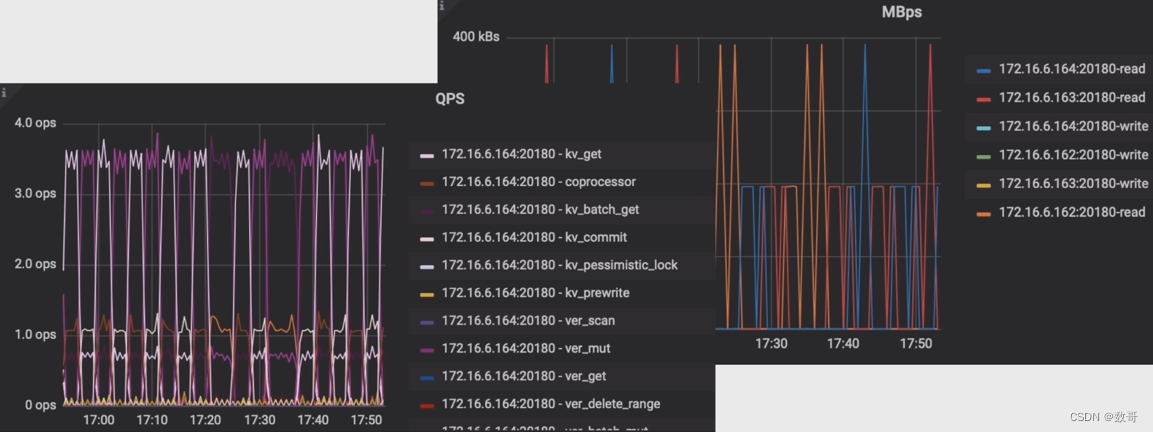
Grafana监控 TiKV-Details —> Cluster - MBps/QPS
Grafana监控 TiKV-Details —> Cluster - Region/Leader
region 如果超过5万个,可能会影响与pd的心跳。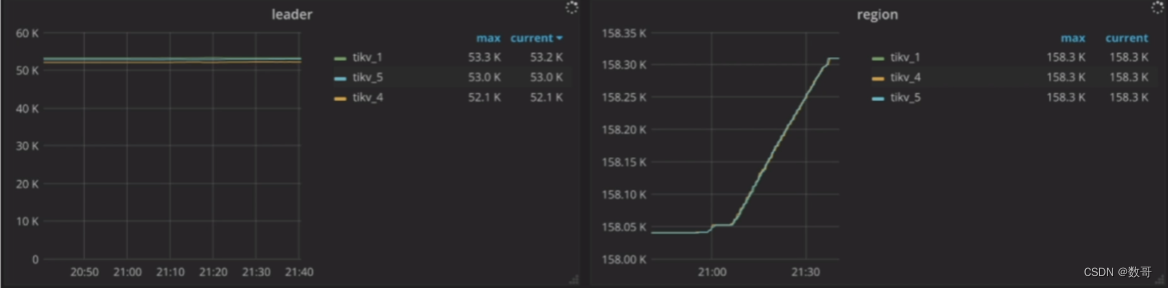
线程池相关
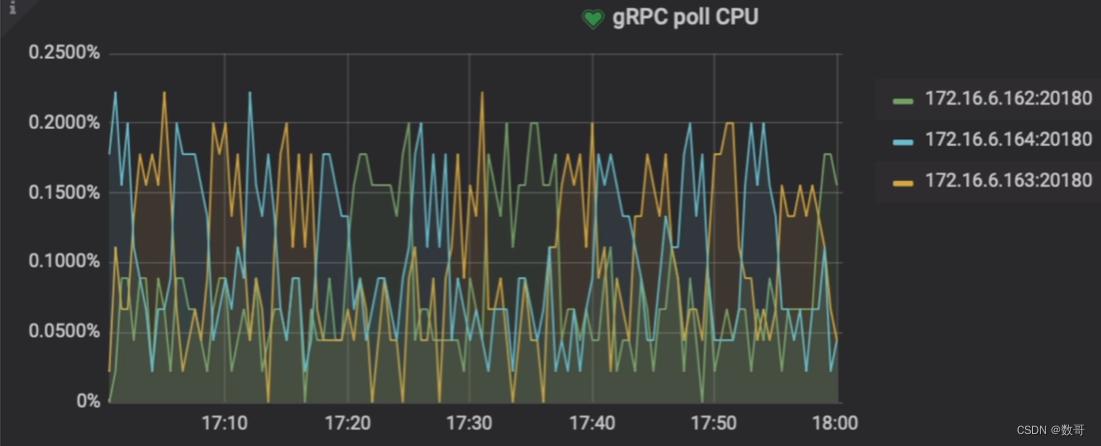
Grafana监控 TiKV-Details —> Thread CPU - gRPC poll CPU
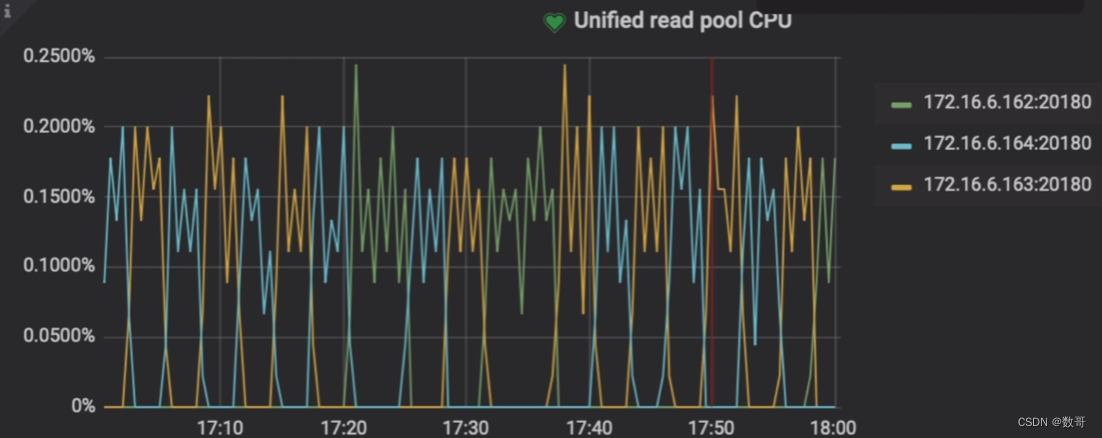
Grafana监控 TiKV-Details —> Thread CPU - Unified Read pool CPU
读线程的数量
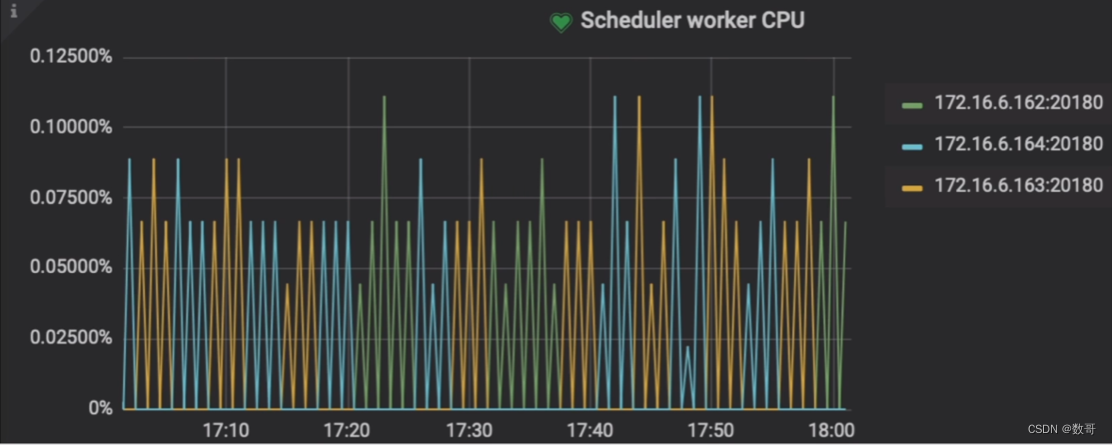
Grafana监控 TiKV-Details —> Thread CPU - Scheduler worker CPU
写线程的数量不要超过: 90% * storage.scheduler_worker_pool_size
Grafana监控 TiKV-Details —> Thread CPU - Raft store CPU
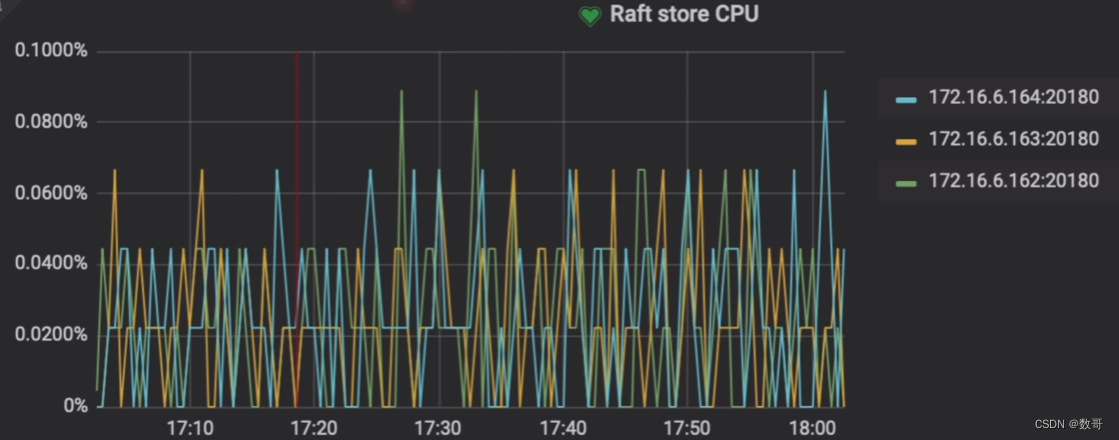
raft线程不要超过: 80% * raftstore.store-pool-size
Grafana监控 TiKV-Details —> Thread CPU - Async apply CPU
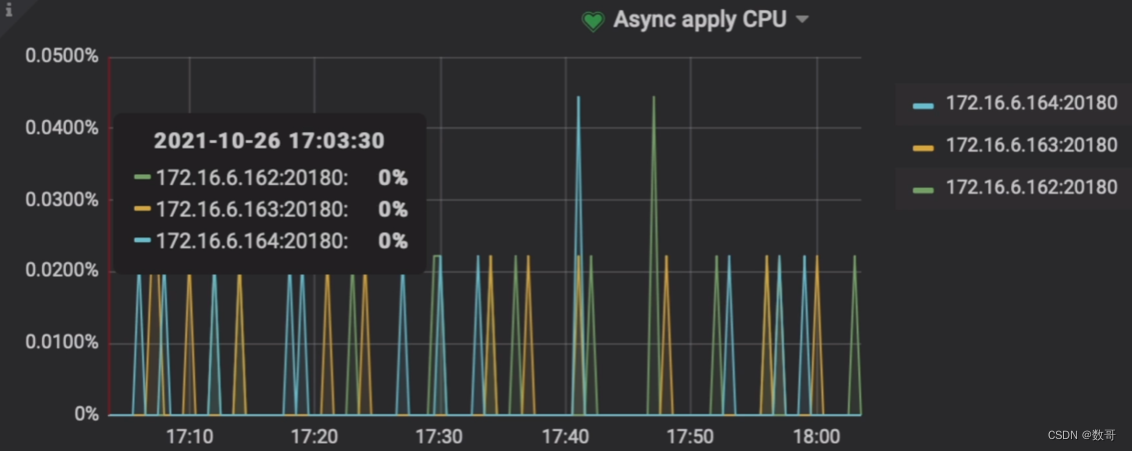
apply线程不要超过: 80% * raftstore.apply-pool-size
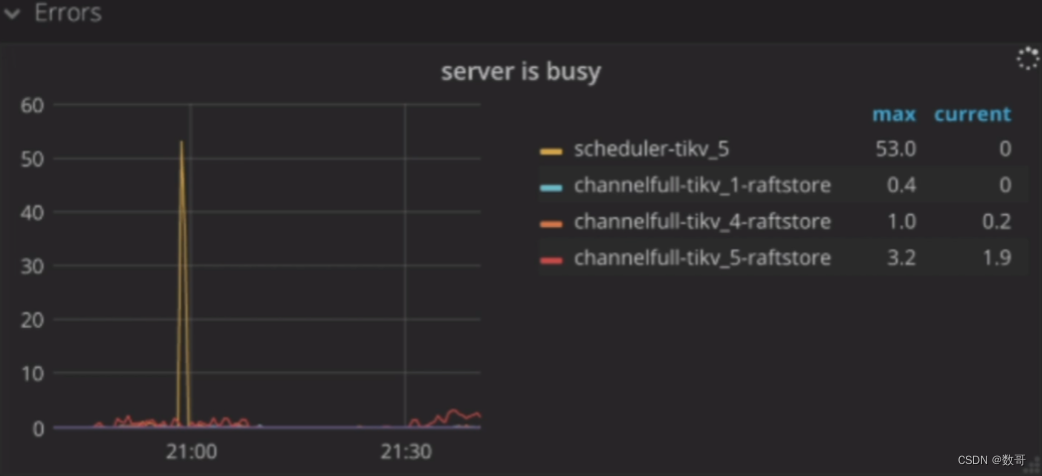
Error相关
Grafana监控 TiKV-Details —> Errors - Server is Busy
Duration相关
** TiDB写入流程**
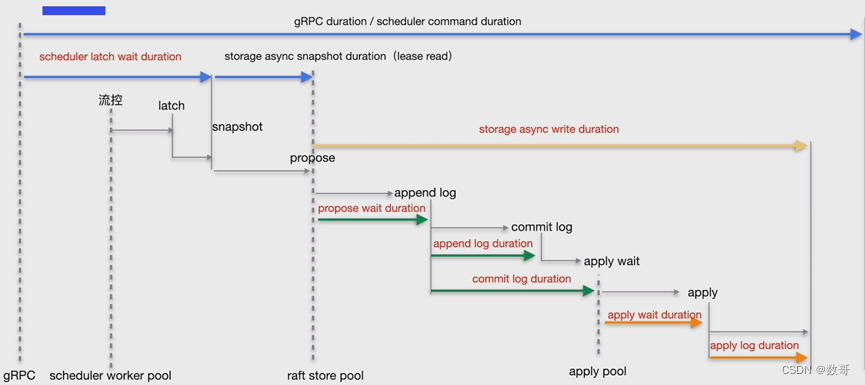
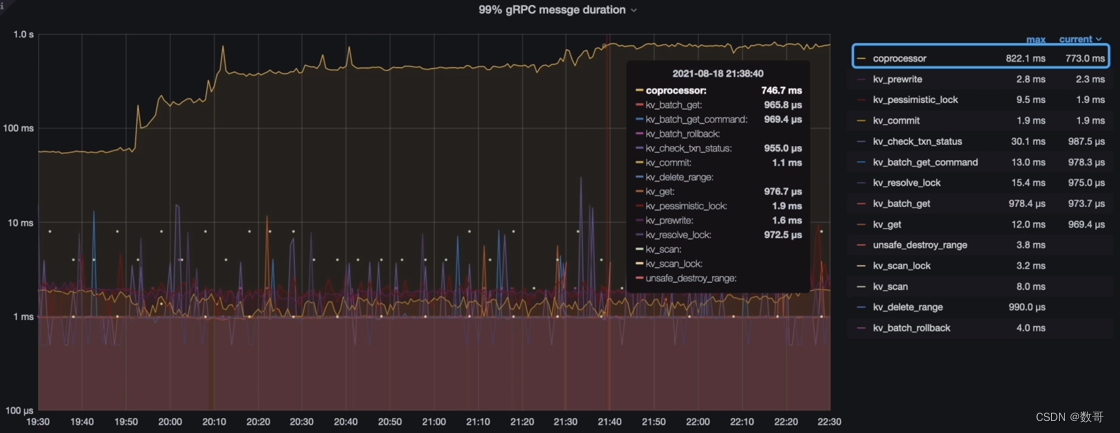
Grafana监控 TiKV-Details —> gRPC - 99% gRPC message duration
这个相当于是整体处理图
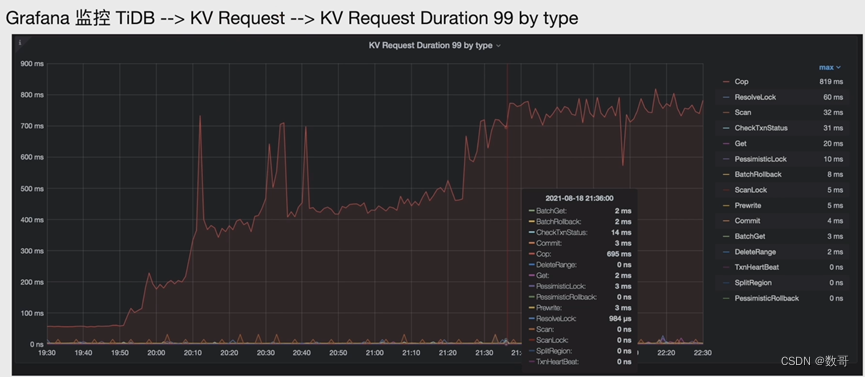
Grafana监控 TiKV-Details —> KV Request —> KV Request Duration 99 by byte
这个图可以判断KV Rquest 多 ,这图包含网络+TiKV的返回耗时。如果要判断到底是网络还是TiKV处理多。 这个要结合其他图
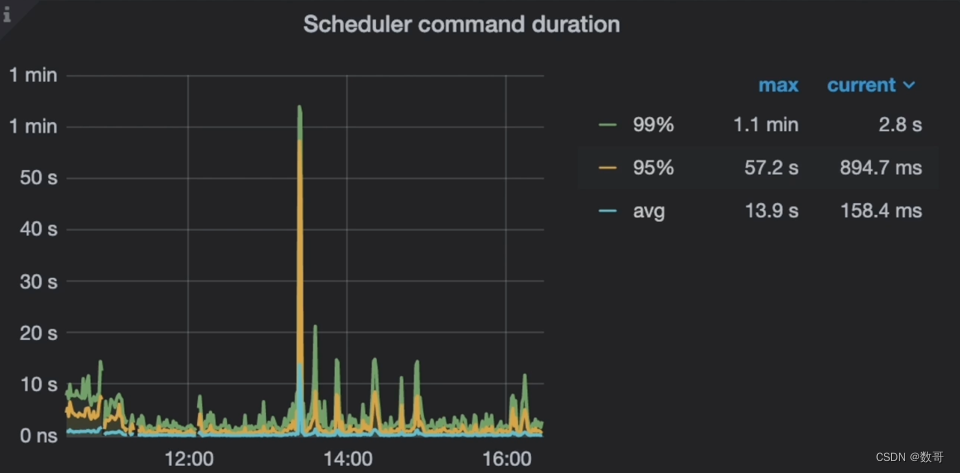
Grafana监控 TiKV-Details —> Schedule-Commit —> Scheduler command duration
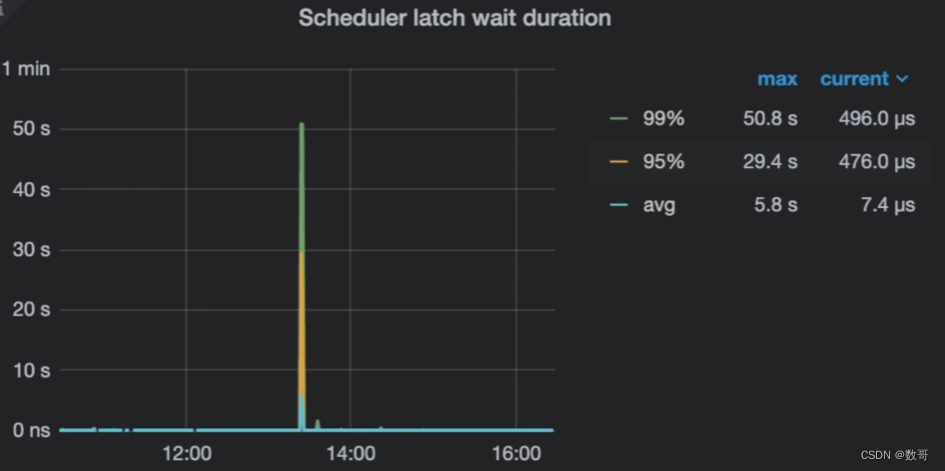
Grafana监控 TiKV-Details —> Schedule-Commit —> Scheduler latch wati duration
latch wati duration: 跟流量相关,可减缓写入速度,相关参数storage.scheduler_pending_write_threshold
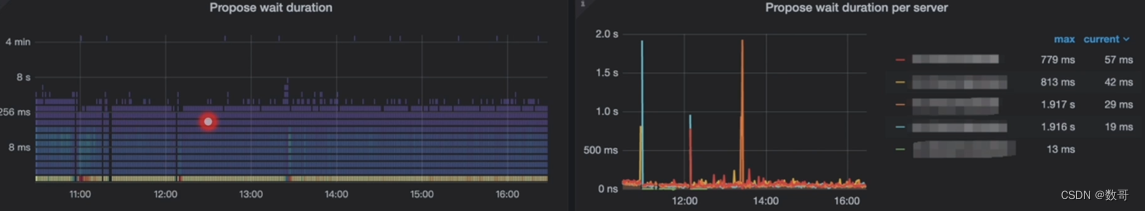
Grafana监控 TiKV-Details —> Raft Propose —> Propose wait duration
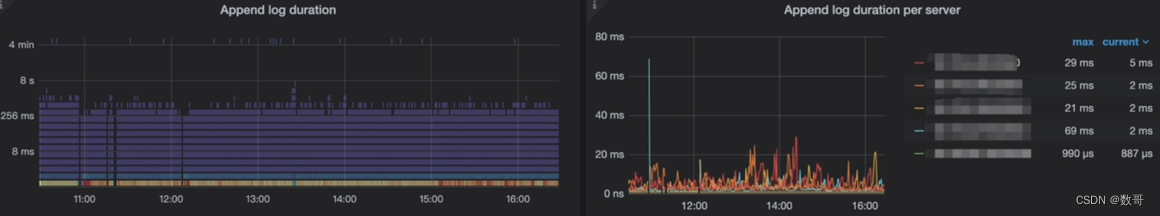
Grafana监控 TiKV-Details —> Raft IO —> Append log duration
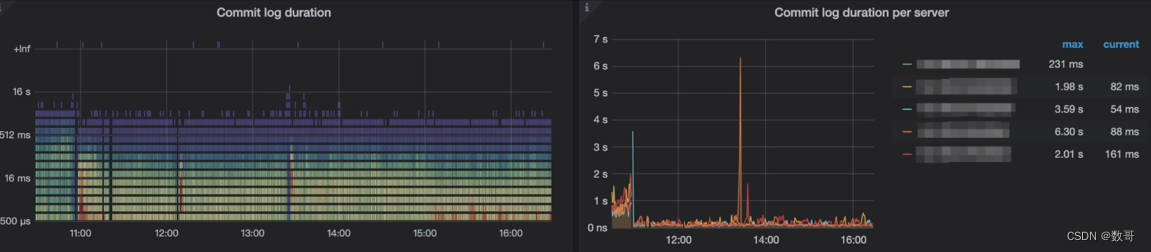
Grafana监控 TiKV-Details —> Raft IO —> Commit log duration
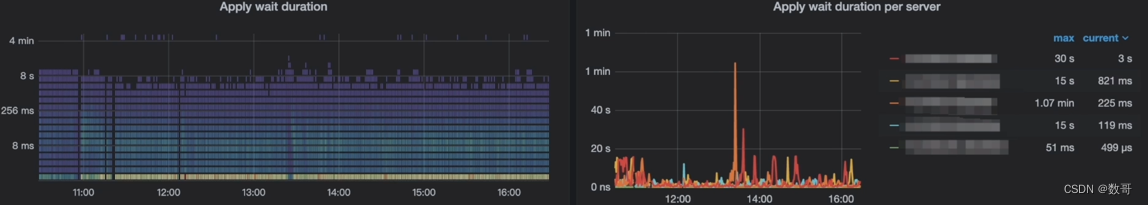
Grafana监控 TiKV-Details —> Raft Propose —> Apply wait duration
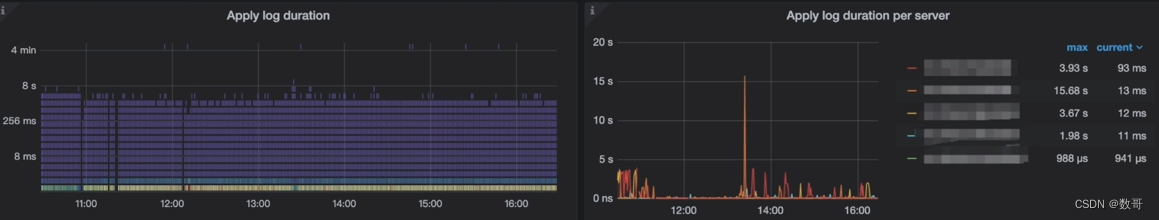
Grafana监控 TiKV-Details —> Raft IO —> Apply log duration
</article>